
Master Productivity Measurement for Peak Performance
Learn effective productivity measurement. Explore key metrics like OKRs, cycle time, & throughput to boost individual, team, and organizational performance.
Most productivity tracking fails because it measures motion, not progress.
A team can log long days, close tickets, sit through back-to-back meetings, and still miss the release that matters. Founders see this all the time. Everyone looks busy. Slack is active. Calendars are full. The burn rate is real. Yet the work that propels the company forward keeps slipping.
The usual fix is more tracking. More timesheets. More task counts. More dashboards. That usually makes the problem worse. Once people know they're being judged on visible activity, they optimize for visible activity. They answer faster, attend more, split work into smaller pieces, and produce cleaner-looking status updates. None of that guarantees useful output.
The issue isn't effort. It's bad productivity measurement.
If you measure hours, people will fill hours. If you measure task count, people will complete smaller tasks. If you measure output without context, teams become feature factories. They ship more and matter less.
A better system starts with a harder question: what kind of value is this team supposed to create, and what inputs are we consuming to create it? That's the shift from busyness to productivity. It sounds obvious, but most organizations never build their measurement around it.
For teams trying to rethink that setup, this modern framework for team productivity is a useful companion because it treats productivity as a system decision, not a surveillance exercise.
Table of Contents
- Introduction Why Most Productivity Tracking Fails
- The Real Meaning of Productivity From Economics to Action
- A Practical Menu of Productivity Metrics and Frameworks
- How to Implement a Measurement System That Works
- Common Pitfalls and How to Avoid Them
- The Next Frontier Measuring AI-Augmented Productivity
Introduction Why Most Productivity Tracking Fails
Often, teams don't have a productivity problem. They have a measurement problem.
Tracking hours worked feels responsible because it's simple. Counting tasks completed feels objective because it produces a number. Neither tells you whether the team is creating value at a reasonable cost in time, attention, and effort. A startup can work late all week and still fail at the one thing that mattered, shipping a stable release, closing a key customer gap, or making a decision fast enough to keep momentum.
That's why productivity tracking often creates resentment. People feel watched, but leaders still don't get answers. The dashboard fills up while delivery stays unpredictable.
Why busyness gets mistaken for performance
A lot of popular advice still treats productivity as a personal discipline problem. Use a better to-do list. Time-block harder. Close more tickets. Those tactics can help at the margin, but they don't solve the underlying issue when the measurement itself is wrong.
If a product team finishes many small tasks while strategic work keeps getting interrupted, the team isn't more productive. It's just more active. If an engineering team logs heavy effort but cycle time keeps stretching because work is fragmented, more effort isn't the answer.
Practical rule: If your metric rewards visible effort more than meaningful progress, people will look productive before they become productive.
What a useful system does differently
A good productivity measurement system distinguishes between three things: what went in, what came out, and what changed because of it. It also surfaces trade-offs. More output can come with more overtime, more context switching, or more burnout. In that case, performance may look better while efficiency gets worse.
That is why strong measurement feels less like monitoring and more like diagnosis. It helps a manager answer questions such as:
- Where is work slowing down: planning, execution, handoff, or decision-making?
- What is consuming team capacity: planned priorities, unplanned work, meetings, support load, or rework?
- Are we improving sustainably: or just extracting more effort from the same people?
Once you start asking those questions, productivity becomes operational. You can improve it. Before that, you're mostly judging appearances.
The Real Meaning of Productivity From Economics to Action
The cleanest definition of productivity is still the economic one. Output relative to input.
McKinsey explains that a foundational way to measure productivity is output relative to input, often calculated at the national level as GDP per total hours worked, and at the firm level as gross value added divided by employees. It also notes that the OECD manual identifies value-added-based labor productivity as the most frequently computed productivity statistic worldwide in McKinsey's productivity explainer.
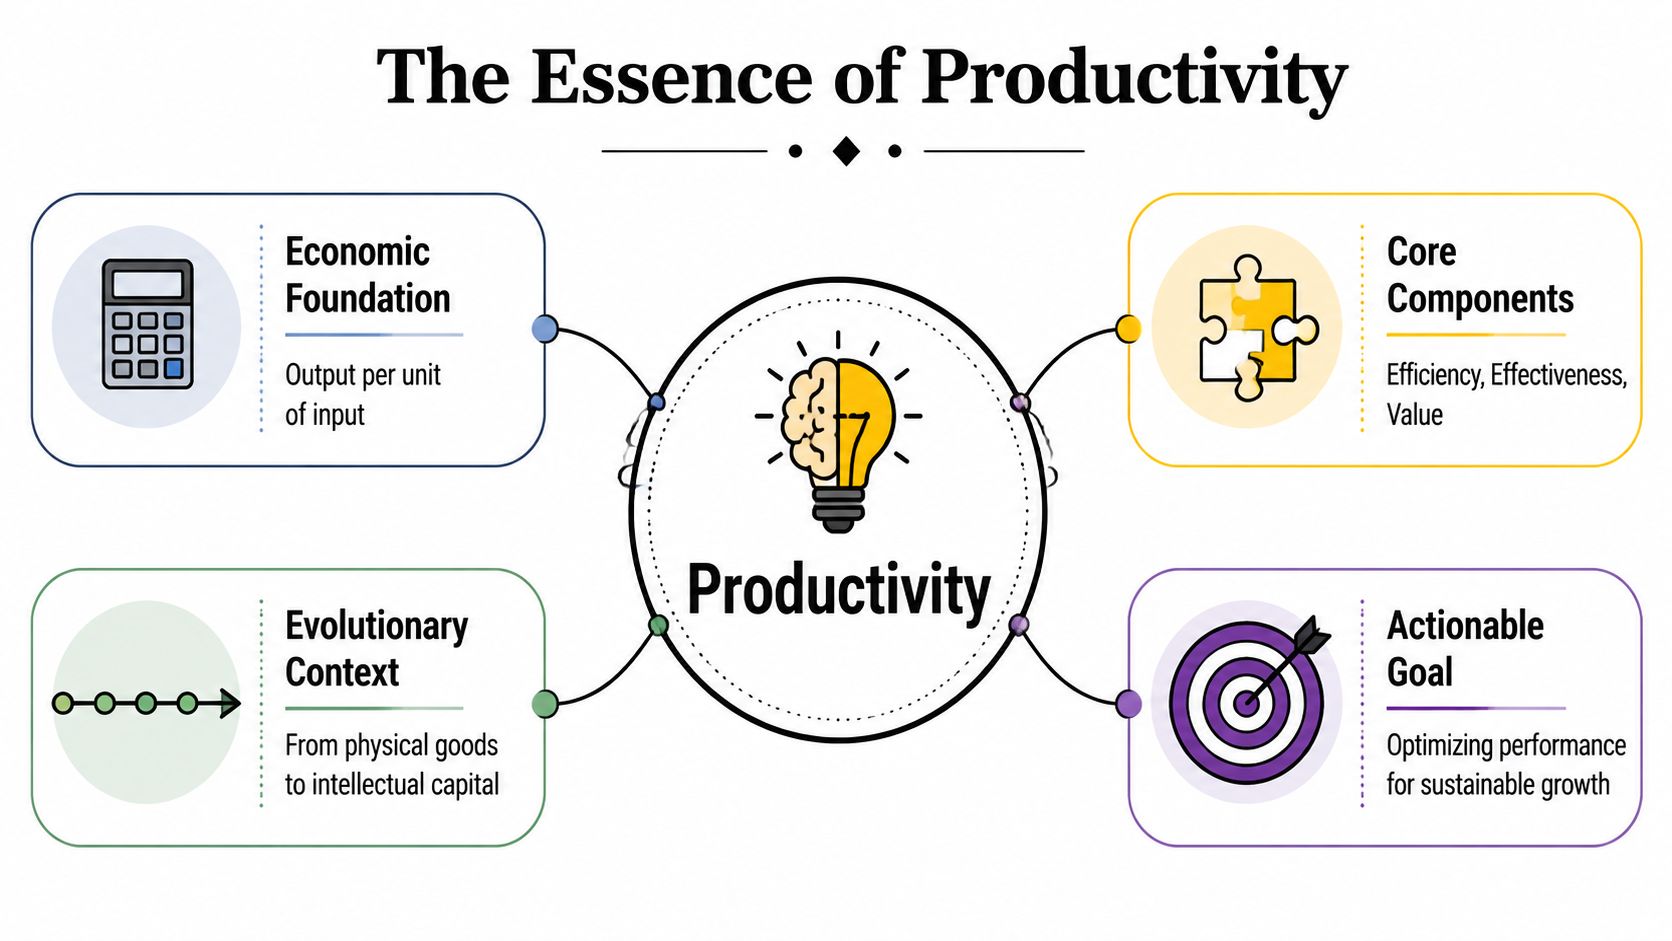
Why economists start with output and input
That definition matters because it cuts through a lot of management noise. Productivity is not "working hard." It's not "being busy." It's not even "producing more." It is producing more value for a given level of input, or producing the same value with fewer inputs.
Think of a kitchen. Inputs include labor, ingredients, time, and equipment. Outputs are meals served. Outcomes are whether customers come back, spend more, or recommend the place. A kitchen can increase output by rushing more dishes out the door, but if quality drops and customers stop returning, the outcome got worse. That isn't a productivity win. It's just output inflation.
Knowledge work has the same trap.
How that translates to knowledge work
In teams, inputs usually include time, headcount, budget, attention, and decision bandwidth. Outputs are things like features shipped, campaigns launched, reports completed, or customer issues resolved. Outcomes are the business effects, such as retained customers, reduced support burden, faster onboarding, or better conversion.
The mistake I see most often is treating outputs as if they were outcomes.
A team ships ten features. Great. Did those features solve a meaningful customer problem? Did they reduce churn risk? Did they simplify the product, or make it harder to support? Output without outcome is where smart teams accidentally become factories for internal activity.
A more grounded model looks like this:
- Inputs answer cost. What did this work consume in hours, focus, money, and coordination?
- Outputs answer delivery. What did the team produce?
- Outcomes answer value. What changed in the business, customer experience, or decision quality because of that work?
A lot of "productivity" programs fail because they measure outputs precisely and outcomes vaguely.
Once you separate those layers, better decisions follow. A content team might publish less often and still become more productive if quality, reuse, and distribution improve. An engineering team might write less code and still create more value if architecture decisions reduce rework and incidents. A founder might spend fewer hours in meetings and make better calls because thinking time improved.
That's the bridge from economics to execution. The formula stays simple. The implementation gets more nuanced because knowledge work produces value that often appears later, indirectly, or through quality rather than volume.
A Practical Menu of Productivity Metrics and Frameworks
Teams usually go wrong by picking metrics that are easy to collect instead of metrics that expose the actual bottleneck.
For knowledge work, a better starting point comes from flow and execution measures. Harrison Clarke highlights three starter measures for engineering productivity in this guide to measuring engineering productivity: average cycle time, time spent by focus area, and the ratio of planned work to unplanned work. That set works because it tells you not only how much is getting done, but how stable and interrupt-driven the system is.
Choose metrics by bottleneck, not by trend
If delivery feels slow, start with cycle time. If priorities keep changing, measure planned versus unplanned work. If teams complain they never get focused time, look at time spent by focus area and meeting fragmentation. If leadership can't tell whether work maps to strategy, add an OKR layer.
Some teams also need an operational lens, especially when software, service, and internal processes overlap. In that case, practical guidance on Cyndra AI for operations is useful because it frames efficiency as a workflow problem rather than a headcount problem.
A lightweight scoring layer can also help if you need to translate multiple signals into one repeatable management view. This productivity score calculator is one example of how teams can standardize a simple baseline without pretending one number captures everything.
Comparison of Key Productivity Metrics
| Metric/Framework | What It Measures | Best For | Common Pitfall |
|---|---|---|---|
| Cycle time | How long work takes from start to completion | Engineering, content, ops, product teams | Teams shorten the metric by slicing work artificially instead of removing friction |
| Time spent by focus area | Where capacity goes across deep work, meetings, support, admin, and coordination | Managers diagnosing attention loss | Categories become too broad, so the data doesn't explain trade-offs |
| Planned vs unplanned work | How much execution follows strategy versus interruption | Product, engineering, startup teams | Leaders blame teams for reactive load they created themselves |
| Planned-to-done ratio | Whether commitments are realistically completed | Sprint-based teams, delivery organizations | People start under-committing to look reliable |
| Revenue per employee or value-added views | High-level output relative to staffing | Executive and firm-level benchmarking | Too coarse for team diagnosis |
| OKRs | Alignment between work and strategic outcomes | Leadership teams, scale-ups, cross-functional orgs | Teams turn them into status theater instead of decision tools |
A few rules make these metrics usable.
- Use team-level metrics first. Individual productivity metrics often distort behavior in knowledge work.
- Pair speed with stability. Faster cycle time is only good if quality and decision quality hold up.
- Track interruptions explicitly. Unplanned work is one of the fastest ways to hide where productivity is leaking.
- Review trends, not snapshots. One rough week rarely means the system is broken.
The best metric is the one that changes a management decision. If it doesn't change a decision, it's reporting, not productivity measurement.
Frameworks are only useful when they force better conversations. Otherwise they become decor.
How to Implement a Measurement System That Works
Most productivity systems fail during implementation, not design. The metrics sound sensible. The dashboard gets built. Then the team either ignores it or starts performing for it.
The fix is to treat productivity measurement as an input-output system, not a single KPI. The OECD notes that productivity is the efficiency with which production inputs are used to create outputs, and warns that aggregate figures can hide major firm-level differences in its overview of measuring productivity. That matters at team level because output can rise while inputs rise even faster. The result looks like growth but behaves like inefficiency.
Build the system around one real question
Start with one business problem, not a desire to "measure productivity better." Those are different.
If releases feel unpredictable, ask why cycle time is unstable. If strategy isn't landing, ask how much team capacity goes to planned work versus interruption. If people look overloaded, ask whether the issue is staffing, poor workflow, or fragmented attention.
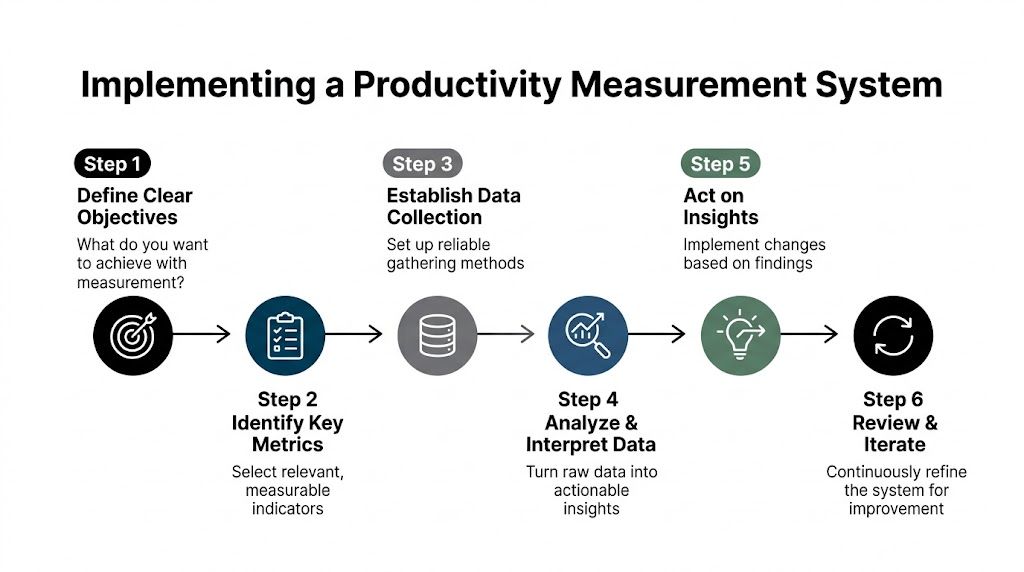
Then build the system in this order:
- Define the outcome. Pick one meaningful result you want to improve, such as faster delivery of planned initiatives or more reliable execution.
- Choose the scope. Decide whether you're measuring an individual workflow, one team, or a broader function. Most organizations should start at team level.
- Select a small metric set. Use one leading outcome signal plus one or two supporting flow or input metrics.
- Establish a baseline. Measure before changing behavior. Without a baseline, every opinion sounds equally convincing.
- Set a review cadence. Weekly or biweekly works well because it keeps the conversation operational.
- Adjust one lever at a time. Reduce meeting density, tighten intake, clarify planning, or improve handoffs. Then watch the trend.
This is also where data quality matters more than people admit. If your calendar, ticketing, time, or workflow data is messy, the analysis will drift quickly. Teams that haven't done the basics should review practices for validating your analytics data before they put too much trust in any dashboard.
Create a review rhythm people trust
Measurement only works when the team believes the system is meant to improve work, not punish people.
A practical review meeting sounds like this:
- What changed in the metric trend
- What changed in the work system
- What do we think caused it
- What single adjustment will we test next
That rhythm matters more than fancy tooling. If the discussion turns into blame, the data gets gamed. If the discussion stays focused on friction, the data gets better over time because people want it to reflect reality.
An OKR layer can help keep those reviews tied to outcomes instead of just throughput. Teams using structured goal systems often benefit from seeing how work ladders up to commitments. This overview of OKR tracking software is useful if you're trying to connect weekly execution signals to broader strategic goals.
Manager's test: If a metric worsens, can your team discuss it openly without fear? If not, the problem isn't the metric. It's the management environment around it.
The strongest systems are boring in the best way. Clear inputs. Clear outputs. A small set of measures. A regular review. Real changes based on what the data says.
Common Pitfalls and How to Avoid Them
Most failed productivity measurement efforts don't fail because the math is wrong. They fail because the incentives are wrong.
Once a metric affects status, compensation, or political standing, behavior changes fast. People protect themselves. Teams shape the work to satisfy the measure. Leaders start arguing about the number instead of the bottleneck.
When metrics become weapons
The fastest way to poison productivity measurement is to turn it into surveillance.
Count tickets per person, compare people publicly, or use cycle time as a proxy for effort, and the system breaks. Knowledge work is collaborative. One person may write little and still remove blockers for five others. Another may close many items by taking easy work. The metric will look objective while rewarding the wrong behavior.
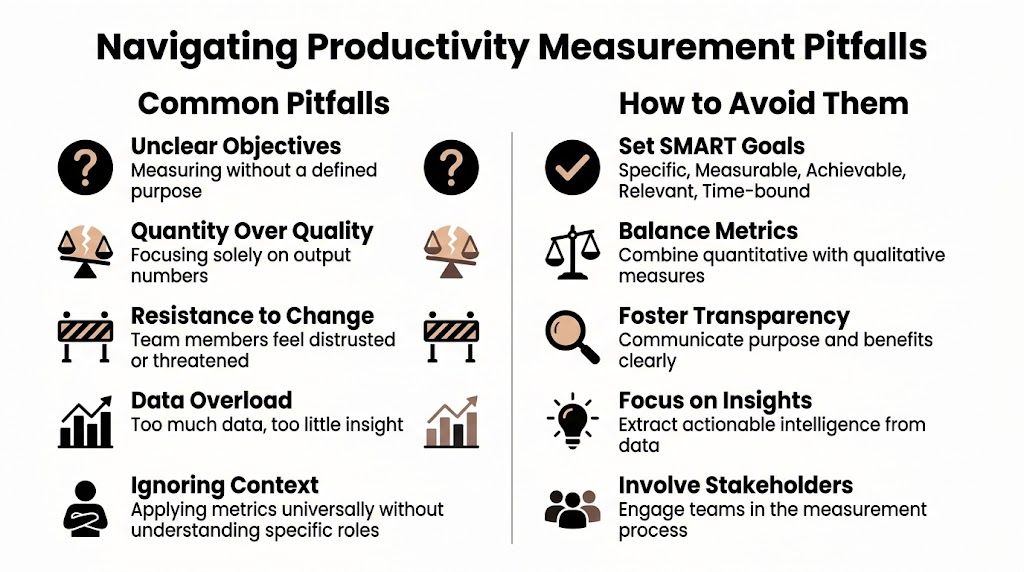
Common failure patterns include:
- Goodhart's law in practice. The metric becomes the target, so the underlying work quality drops.
- Observer effect. People change visible behavior because they're being measured.
- Data overload. Leaders collect too much, then act on none of it.
- Context stripping. The same metric gets applied to different roles as if the work were identical.
The correction is simple, but not always easy.
- Measure teams before individuals. Most useful productivity gains come from system fixes.
- Pair quantitative data with narrative context. A number without explanation is often misleading.
- Limit the dashboard. If everything matters, nothing gets managed.
- Invite the team into interpretation. The people doing the work usually know why the trend moved.
A metric should start a conversation, not end one.
When better measurement still doesn't fix the work
There's another trap at the opposite extreme. Some leaders assume poor results must be caused by poor measurement. Sometimes that's true. Often it isn't.
Research on construction productivity from the Becker Friedman Institute working paper found that alternative physical and task-based measures still showed stagnation, reinforcing that weak productivity wasn't just a data artifact in that sector's construction productivity analysis. The management lesson is broader than construction. Better instrumentation does not automatically repair a broken operating model.
That shows up inside companies too. You can improve dashboards and still have slow decision cycles, fragmented ownership, constant priority changes, and approval bottlenecks. In those cases, measurement helps you see the issue more clearly. It doesn't solve it by itself.
A few warning signs tell you the production model is the problem:
- Work waits on decisions more than execution
- Teams spend large chunks of time on handoffs and approvals
- The same problems reappear after every reporting improvement
- Managers debate definitions more than they remove constraints
When that happens, stop polishing the dashboard. Fix the workflow, ownership model, or planning process.
The Next Frontier Measuring AI-Augmented Productivity
Traditional productivity measurement assumes human labor is the main unit of production. That assumption is weakening fast in knowledge work.
When AI helps draft, research, summarize, code, review, and synthesize, hours worked stop being a clean proxy for value. A person may spend less time producing a first draft and more time validating, editing, and making higher-quality decisions. If you only measure visible output per hour, you can miss the underlying gain.

From hours worked to validated progress
The more useful lens comes from the OECD productivity manual context around measurement challenges in knowledge work, where output can be intangible and mismeasurement is common. In AI-augmented work, the practical question shifts from "how many hours did someone work?" to "how much validated progress did the AI-human system produce per unit of attention?" That framing is captured in the OECD-related material hosted by the UN statistics system in this productivity manual PDF.
That sounds abstract until you turn it into operating questions:
- Speed: Did AI reduce time to a usable draft, decision memo, prototype, or code change?
- Quality: Did the final work hold up under review, customer use, or production constraints?
- Decision impact: Did the team make better calls, faster, because AI reduced search and synthesis friction?
- Attention efficiency: Did AI free up deep work, or just create more review overhead?
Those are better measures than raw activity counts because they capture the actual work of modern knowledge teams. The output isn't just text or code. It's validated progress.
A practical model for AI-augmented teams
Typically, the right move isn't to invent a futuristic dashboard. It's to adapt existing productivity measurement around AI's role in the workflow.
Use a simple before-and-after lens:
- Track task-level speed. Compare how long the same class of work takes with and without AI support.
- Review quality at the end of the chain. Faster drafts don't matter if review load spikes.
- Watch where human attention moved. The gain often appears in better prioritization, stronger judgment, or more experiments run.
- Measure validated completion. Count work as productive when it passes the standard that matters, not when AI produces the first output.
This is also where tool choice starts to matter. Teams experimenting with workflow support, planning, and execution layers can learn a lot from the broader category of AI productivity tools, especially when they evaluate tools based on decision quality and follow-through instead of novelty.
A short explainer can help if your team is still thinking about AI only as automation:
The next generation of productivity measurement won't ignore time. It just won't worship it. The central unit is becoming validated progress, created by a human using tools, judgment, and increasingly, AI systems. Teams that understand that shift will make better decisions long before the dashboards catch up.
Keep going with Beyond Time
Beyond Time gives you the measurement layer that connects daily work to outcomes worth caring about.
- Time Blocking Template — Schedule deep work before the reactive day takes over.
- Goal-First Productivity Method — Start with outcomes so every task earns its place.
- Sunday Reset: Weekly Time Review — A weekly review ritual that actually improves next week.
- Best AI Productivity Apps 2026 — Find the tools that measure output, not just effort.
Tribble Software Private Limited builds Beyond Time, an AI-powered goal achievement system designed for people who want productivity measurement to lead to action, not just reporting. It connects OKRs, milestones, routines, habits, time tracking, and daily AI coaching into one loop, so founders, professionals, students, and self-improvers can turn goals into measurable progress with far less drift between planning and execution.
Put this into practice
Free tools that match this article.
Time Blocking Template
Map your day into focused time blocks with a free printable time blocking template.
Try Time BlockingTime ManagementWeekly Schedule Optimizer
Generate an optimized weekly schedule with AI-powered time blocking for maximum productivity.
Try Schedule OptimizerGoal SettingGoal Setting Worksheet
Turn a vague goal into milestones, habits, blockers, and a weekly review plan.
Try Goal WorksheetAssessmentProductivity Score Calculator
Discover your productivity score and get personalized recommendations to improve.
Try Productivity ScoreKeep exploring this topic
Goal setting guide
Start with the fundamentals of setting goals that turn into action.
Goal frameworks compared
Choose between SMART goals, OKRs, BHAGs, and 12-week goals.
Time blocking guide
Turn priorities into protected calendar blocks.
15-minute time blocks
Plan and review your day with more realistic precision.
Related Articles

10 Measurable Goals Examples for 2026
Find 10 powerful measurable goals examples for business, health, and career. Learn how to set and track SMART goals with specific metrics and routines for 2026.

OKR Tracking Software: From Planning to Achievement in 2026
Confused by OKR tracking software? This guide explains key features, how to choose the right tool, and how to turn your goals into daily achievements.

How to Track Multiple Goals Without Getting Overwhelmed
Learn a proven system for managing multiple goals simultaneously without losing focus or burning out. Practical frameworks for tracking 3-5 goals at once.
Accountability Partner Guide: Achieve Goals Faster
Learn how to find, structure, and get the most from an accountability partner. Research shows accountability can boost goal achievement by up to 95%.
5-Year Plan Template: Build Your Life Roadmap Step by Step
Build your life with this step-by-step 5 year plan template. Set goals across 5 key life domains and break them into year-by-year milestones you can act on.
How to Set Life Priorities: A Framework for What Matters Most
Learn how to set priorities in life with a proven values-based framework. Discover what matters most and start building goals aligned with your life today.